Various Satellite Views and how I interpret
This page is to explain what views off of the GOES satellite are
useful.
The pictures were grabbed on the evening of June 21, 2021 where
three fires in Colorado are visible to GOES. The fires are the Oil
Springs (north of Grand Junction), West (far northwest corner of
the state) and Sylvan (in Eagle County). The sun had not set yet
when I grabbed these images, however being in the late
afternoon/evening, fire activity for these fires was at its peak
for the day. I circled the three fires in the images that follow
First the "GeoColor"
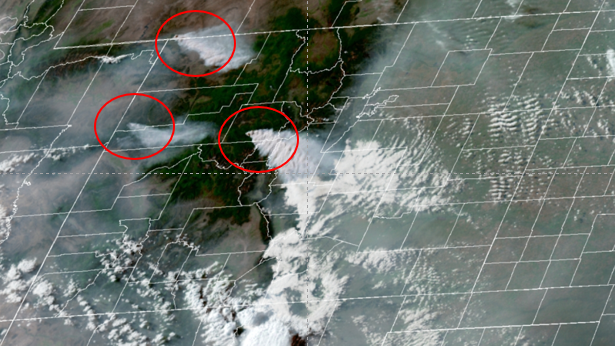
Here the smoke plumes are clearly visible and fortunately there are
no additional clouds. Note the Sylvan smoke plume goes over Summit
County at the far southern end of the county, so Ruby Ranch is
spared the Near Surface Smoke for the moment. A wind shift could
change that quickly.
The next picture is Band 1 which is Blue Light, this only shows
images during daylight but sometimes can help pick out the smoke
plumes:
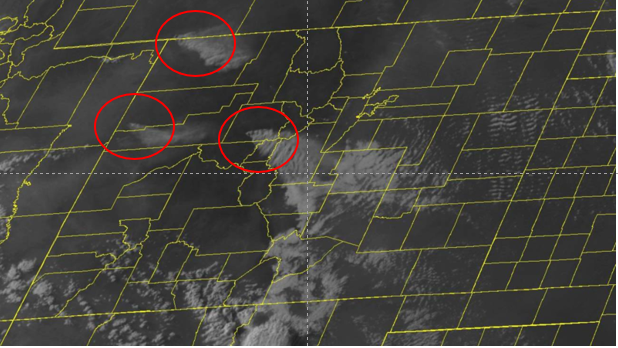
To be honest I think the smoke is more visible in the GeoColor
The next is Band 7 which is the only IR band that shows the fires. I
guess I would have to see what the spectral distribution of wood
burning is. The GOES captures many different IR wavelengths both
above and below the 3900 nm of Band 7.
Since the eye can not see this wavelength (hence why it is called
Infrared), computers have to take the intensity at the 3900nm
wavelength and map it into greyscale that the eye can see. NOAA and
CSU use different mapping algorithms.
Here is the image from the NOAA website:
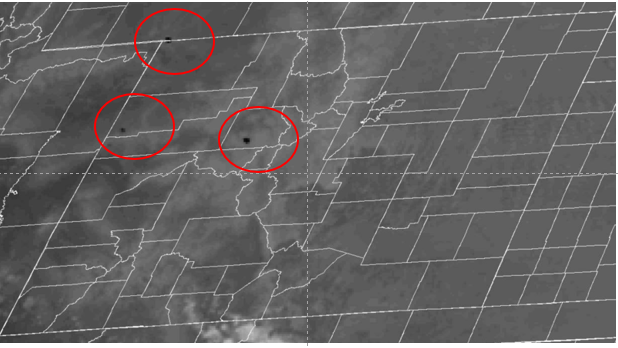
The fires appear black in this rendering.
Colorado State University (CSU) maps it differently. They show the
fires as white as seen here:
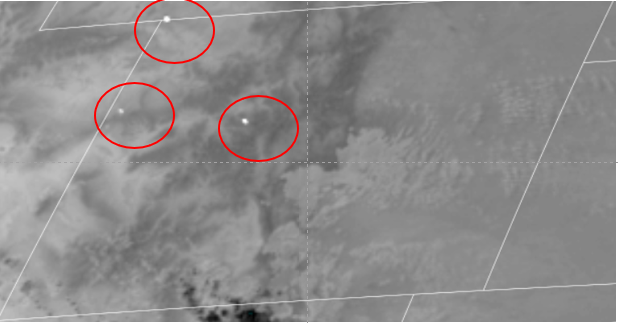
I think it is easier to see than the one on the NWS page.
In addition, as I learn to use the CSU site, I think it is not only
superior in the mapping algorithms, but also usability both on
computers and on mobile devices.
Page maintained by Don Samuels
Last update: 07/10/21